op_traversal P98 Spikes
Hi TinkerPop team!
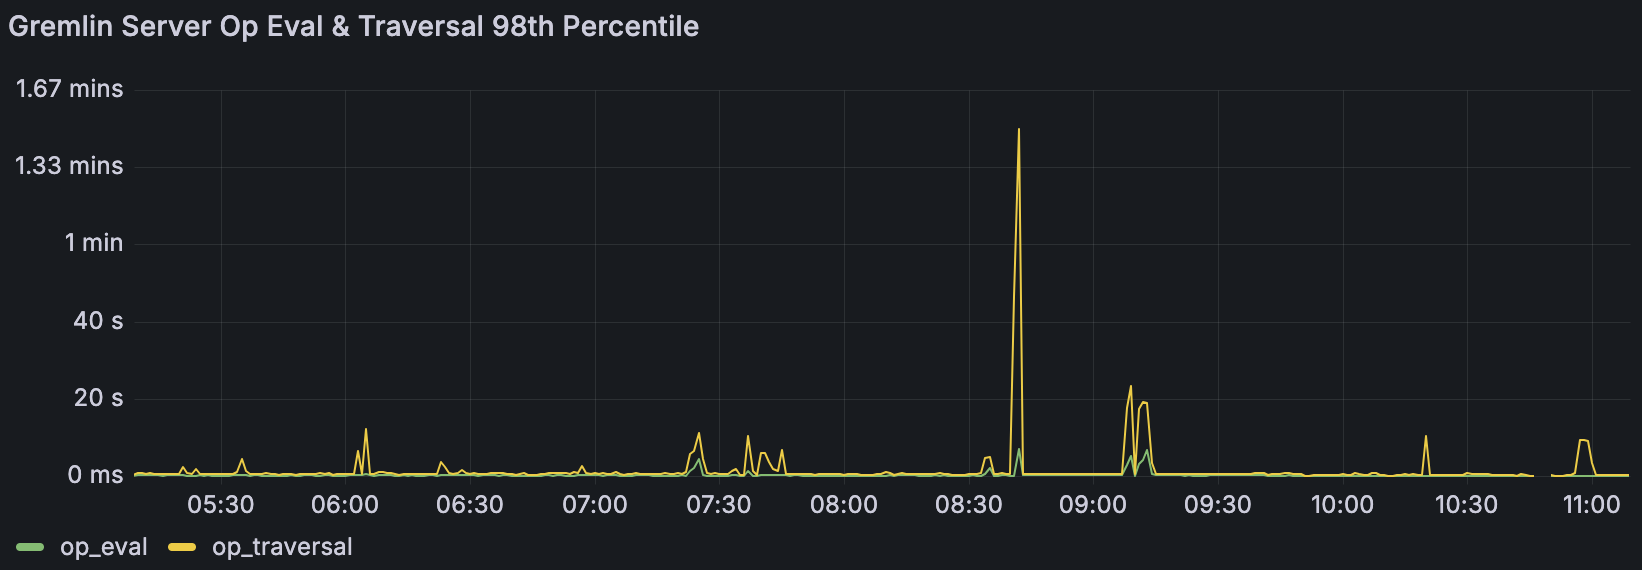
I'm observing these abrupt spikes in my gremlin server P98 metrics in my JanusGraph environment. I've been looking at the TraversalOpProcessor (https://github.com/apache/tinkerpop/blob/master/gremlin-server/src/main/java/org/apache/tinkerpop/gremlin/server/op/traversal/TraversalOpProcessor.java) code over the last couple days for some ideas of what could be causing it but I'm not seeing an obvious smoking gun so figured I'd ask around.
The traversal in question is being submitted from Rust via Bytecode using gremlin-rs. Specifically with some additions I've made that added mergeV & mergeE among other things. It's in a PR awaiting the maintainer's review, but that's not really relevant to my question, but over here if you want to see it: https://github.com/wolf4ood/gremlin-rs/pull/214. The GraphSONV3 serializer is what's being used by the library.
Attached is a screenshot of the spikes I'm referring to. When not having these abrupt spikes to seconds & minutes the baseline P98 is usually around 300-700ms. I have a worker thread pool of 16, gremlin pool of 8, and the default boss pool of 1. The underlying host has 8 cores, but I rarely see its cpu load go above 2. The worker thread pool of 16 was part of an attempt to see if I could get more writes out the otherside of JanusGraph, before I found the metric that showed its CQLStoreManager was not building up a queue after all.
GitHub
tinkerpop/gremlin-server/src/main/java/org/apache/tinkerpop/gremlin...
Apache TinkerPop - a graph computing framework. Contribute to apache/tinkerpop development by creating an account on GitHub.
GitHub
Build software better, together
GitHub is where people build software. More than 100 million people use GitHub to discover, fork, and contribute to over 420 million projects.


Solution:Jump to solution
For anyone else that finds this thread the things I ended up finding to be issues:
- Cassandra's disk throughput I/O (EBS gp3 is 125MB/s by default, at least for my use case a I was periodically maxxing that out, increasing to 250MB/s resolved that apparent bottleneck). So if long sustained writing occured the 125MB/s was not sufficent.
- Optimizing traversals to using mergeE/mergeV that were either older groovy-script based evaluations I was submitting or older
fold().coalesce(unfold(),...) style "get or create" based vertex mutations....3 Replies
The spikes tend to correlate to long sustained periods of writes. Normally my application will write a series of a few dozens of vertices through the traversal. But sometimes it ends up being 10s of thousands. Obviously I don't try to do those all at once. The stream of things to write are chunked to batches of 50 vertices at at time and are submitted as concurrent traversals. My connection pool to JanusGraph is currently capped to 5, so no more than 5 should be getting submitted concurrently which is why I'm somewhat confused why the 10s of thousands seem to cause this outsized impact if from the GremlinServer's perspecive it isn't getting more than 5 concurrently unless the nature of sustained traffic is an issue. However I haven't found a metric to confirm this from the JanusGraph/GremlinServer side.
On the JanusGraph side I've made dashboards visualizing the CQLStorageManager which never seems to have a build up on writes to Cassandra from what I can tell which leads me to be suspect the
TraversalOpProcessor is the bottleneck, but from what I can tell of the JMX emitted metrics there doesn't appear to be an emitted metric of the work queue for the underlying created ExecutorService here: https://github.com/apache/tinkerpop/blob/418d04993913abe60579cbd66b9f4b73a937062c/gremlin-server/src/main/java/org/apache/tinkerpop/gremlin/server/util/ServerGremlinExecutor.java#L100-L105.
So as a proxy I've been using the JMX metric metrics_org_apache_tinkerpop_gremlin_server_GremlinServer_op_traversal_Count but that only tells me the number of traversals from the perspective of the metric (https://github.com/apache/tinkerpop/blob/418d04993913abe60579cbd66b9f4b73a937062c/gremlin-server/src/main/java/org/apache/tinkerpop/gremlin/server/op/traversal/TraversalOpProcessor.java#L80) as they come through and not their possible build up in the task queue for the executor service.
I'm inferring they're building up though because the timer starts before the traversal is submitted into the executor service here: https://github.com/apache/tinkerpop/blob/418d04993913abe60579cbd66b9f4b73a937062c/gremlin-server/src/main/java/org/apache/tinkerpop/gremlin/server/op/traversal/TraversalOpProcessor.java#L212C44-L212C60, and then is actually submitted for execution on line 304. If they're not building up then I'm very perplexed what a few traversals could be doing to distort the P98 by so much if it isn't sitting in the queue for most of it.
The traversal in question is a batching up of upserts to the graph. Each vertex's worth of info is loaded into various hashmaps that then get combined into a collective map and then each vertex's info is then combined into a list that's injected at the start of the traversal. It looks like this:
The criteria that's in lookup that gets applied to mergeV() should return a single upserted vertex since I directly dictate the vertex id as a parameter so all the side_effects steps after that should apply to a single vertex after the injected list is unfolded and the iter() at the end should dictate no response I/O.
single_props will have usually 7-10 properties in it. Two of which may be very large documents (10s MBs) for leveraging full-text searching with my JanusGraph deployment being backed by Elasticsearch. It's worth mentioning though the latency screenshot has the Elasticsearch indices disabled as I was trying to narrow the space of what may have been slowing things down and I've confirmed through system telemetry no I/O is going to Elasticsearch.
set_props will have usually 6-8 properties in it, with each one having having only 2-3 properties contained for its corresponding key.
The edges varies greatly. At least 1 entry but may have dozens.There could potentially be lots of different causes for this as there are a lot of pieces in the scenario you laid out. Something worth investigating is whether transactions are causing a slowdown. JanusGraph itself has different options for transactional behavior. I'm not that familiar with JanusGraph, but I believe it has different locking mechanisms based on the storage backend being used.
Solution
For anyone else that finds this thread the things I ended up finding to be issues:
- Cassandra's disk throughput I/O (EBS gp3 is 125MB/s by default, at least for my use case a I was periodically maxxing that out, increasing to 250MB/s resolved that apparent bottleneck). So if long sustained writing occured the 125MB/s was not sufficent.
- Optimizing traversals to using mergeE/mergeV that were either older groovy-script based evaluations I was submitting or older
fold().coalesce(unfold(),...) style "get or create" based vertex mutations.
The former was identified using EBS volume stats and confirming at a lower level using iostats the latter was via gathering and monitoring metrics emitted by Gremlin Server (in JanusGraph).